
Mathematics, 07.04.2021 22:20 reeseebaby89
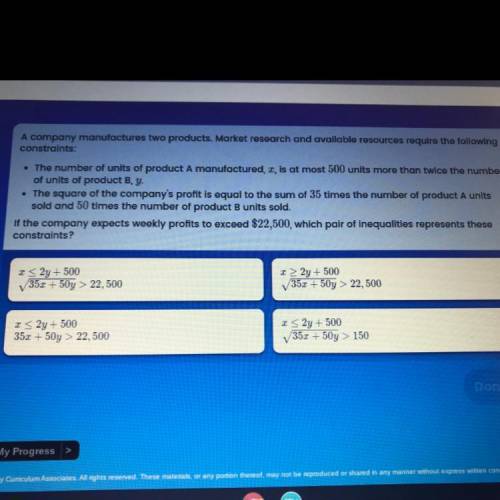
A company manufactures two products Market research and available resources require the followir constraints The number of units of product A manufactured at most 500 units more than twice the of units of product B. y. The square of the company's profit is equal to the sum of 35 times the number of product A units sold and 50 times the number of product units . if the company expects weekly profits to exceed \$22,500 , which pair of inequalities represents these constraints?

Answers: 1


Other questions on the subject: Mathematics
Mathematics, 21.06.2019 12:50, rntaran2002
Nneeedd 1.find the residual if you know the actual number is 5.2 and the predicted value is 4.8
Answers: 3
Mathematics, 21.06.2019 20:50, karaisabelhill
Find the missing variable for a parallelogram: a = latex: 32in^2 32 i n 2 h = b = 6.3 in (1in=2.54cm)
Answers: 2
Mathematics, 22.06.2019 02:30, misk980
Atrain traveled for 1.5 hours to the first station, stopped for 30 minutes, then traveled for 4 hours to the final station where it stopped for 1 hour. the total distance traveled is a function of time. which graph most accurately represents this scenario? a graph is shown with the x-axis labeled time (in hours) and the y-axis labeled total distance (in miles). the line begins at the origin and moves upward for 1.5 hours. the line then continues upward at a slow rate until 2 hours. from 2 to 6 hours, the line continues quickly upward. from 6 to 7 hours, it moves downward until it touches the x-axis a graph is shown with the axis labeled time (in hours) and the y axis labeled total distance (in miles). a line is shown beginning at the origin. the line moves upward until 1.5 hours, then is a horizontal line until 2 hours. the line moves quickly upward again until 6 hours, and then is horizontal until 7 hours a graph is shown with the axis labeled time (in hours) and the y-axis labeled total distance (in miles). the line begins at the y-axis where y equals 125. it is horizontal until 1.5 hours, then moves downward until 2 hours where it touches the x-axis. the line moves upward until 6 hours and then moves downward until 7 hours where it touches the x-axis a graph is shown with the axis labeled time (in hours) and the y-axis labeled total distance (in miles). the line begins at y equals 125 and is horizontal for 1.5 hours. the line moves downward until 2 hours, then back up until 5.5 hours. the line is horizontal from 5.5 to 7 hours
Answers: 1
You know the right answer?
A company manufactures two products Market research and available resources require the followir con...
Questions in other subjects:


Mathematics, 22.09.2021 04:40

Biology, 22.09.2021 04:40


