
Mathematics, 07.04.2021 20:20 ybetancourt1
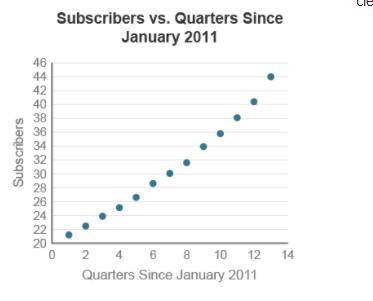
Online entertainment streaming services have gained in popularity in recent years as an alternative to traditional television. One such company has seen steady growth in each period of 3 months, called a quarter, over the past 4 years. The scatterplot shows the relationship between the number of quarters passed since January 2014 and the number of members to the streaming service. A least-squares equation that summarizes this relationship is members hat = 1.829 (quarters) minus 18.108, with a value for r of 0.991.
A graph titled subscribers versus quarters since January 2011 has quarters since January 2011 on the x-axis, and subscribers on the y-axis. Points are in a line with positive slope.
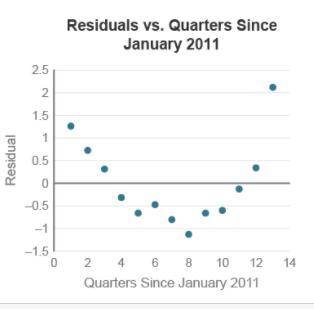
A graph titled Residuals versus quarters since January 2011 has quarters since January 2011 on the x-axis, and Residual on the y-axis. The points curve down, and then curve up.
Based on the residual plot, is a linear model appropriate for summarizing this relationship?
A linear model is appropriate because the value of r is close to 1.
A linear model is appropriate because the residual plot is curved.
A linear model is not appropriate because the residual plot shows a clear pattern.
A linear model is not appropriate because the scatterplot relating time and subscribers shows a clear pattern.

Answers: 1


Other questions on the subject: Mathematics
Mathematics, 21.06.2019 16:40, lawrencebenoit7194
This question awards 100 ! i really don’t want to fail i will also mark you !
Answers: 2
Mathematics, 21.06.2019 18:00, cici170
Each month, a shopkeeper spends 5x + 14 dollars on rent and electricity. if he spends 3x−5 dollars on rent, how much does he spend on electricity? for which value(s) of x is the amount the shopkeeper spends on electricity less than $100? explain how you found the value(s).
Answers: 2
You know the right answer?
Online entertainment streaming services have gained in popularity in recent years as an alternative...
Questions in other subjects:
Mathematics, 02.08.2019 13:10


Mathematics, 02.08.2019 13:10

Chemistry, 02.08.2019 13:10

English, 02.08.2019 13:10


