
Mathematics, 07.04.2021 20:10 lukeperry
Many Texas cities have experienced substantial growth in population over the last 20 years. The growth of Houston, Texas, since 2015 is shown in the scatterplot. A least-squares equation that relates the number of years since 2015 to the population of that year (in millions) is given by Population hat = 0.025 (year) + 2.01.
A graph titled Houston Population versus years since 2005 has years since 2005 on the x-axis, and population (millions) on the y-axis. A line of best fit goes through (4, 2.1) and (10, 2.25)
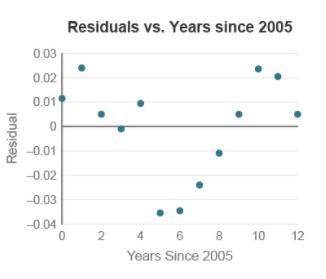
A graph titled Residuals versus years since 2005 has years since 2005 on the x-axis, and residual on the y-axis. The points curve down, and then curve back up.
Based on the residual plot, is a linear model suitable for modeling the population growth of Houston?
A linear model is suitable because a pattern is evident in the residual plot.
A linear model is not suitable because the residuals do not cluster around zero.
A linear model is not suitable because the residual plot shows a curved pattern.
A linear model is suitable because the residuals seem to be randomly scattered.


Answers: 2


Other questions on the subject: Mathematics
Mathematics, 21.06.2019 13:30, angelina0miles
For which rational expression is -2 an excluded value of x?
Answers: 1
Mathematics, 21.06.2019 19:40, Candieboo4006
It appears that people who are mildly obese are less active than leaner people. one study looked at the average number of minutes per day that people spend standing or walking. among mildly obese people, the mean number of minutes of daily activity (standing or walking) is approximately normally distributed with mean 376 minutes and standard deviation 64 minutes. the mean number of minutes of daily activity for lean people is approximately normally distributed with mean 528 minutes and standard deviation 107 minutes. a researcher records the minutes of activity for an srs of 7 mildly obese people and an srs of 7 lean people. use z-scores rounded to two decimal places to answer the following: what is the probability (image for it appears that people who are mildly obese are less active than leaner people. one study looked at the averag0.0001) that the mean number of minutes of daily activity of the 6 mildly obese people exceeds 420 minutes? what is the probability (image for it appears that people who are mildly obese are less active than leaner people. one study looked at the averag0.0001) that the mean number of minutes of daily activity of the 6 lean people exceeds 420 minutes?
Answers: 1
Mathematics, 21.06.2019 22:00, blythephillips2734
Benjamin is making bow ties. how many 1/2yards lomg bow ties can he make if he has 18 feet of fabric?
Answers: 2
Mathematics, 21.06.2019 23:00, kedjenpierrelouis
Qrst is a parallelogram. determine the measure of ∠q pls
Answers: 2
You know the right answer?
Many Texas cities have experienced substantial growth in population over the last 20 years. The grow...
Questions in other subjects:

English, 16.04.2021 06:00

Social Studies, 16.04.2021 06:00

Biology, 16.04.2021 06:00
English, 16.04.2021 06:00


