
Mathematics, 07.04.2021 20:00 rehel5106
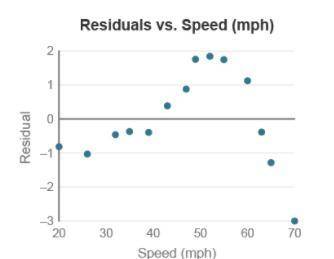
Many new cars provide detailed information about engine performance on the dashboard. One such feature allows drivers to observe current fuel efficiency, recorded in miles per gallon, as they drive. A consumer takes a long trip driving at different speeds, while a passenger records both driving speed in miles per hour and fuel efficiency for a number of selected points along the trip. A least-squares equation that relates speed to fuel efficiency is given by Efficiency hat = 0.104 (speed) minus 25.444.
A graph titled residuals versus speed (miles per hour) has speed (miles per hour) on the x-axis, and residual on the y-axis. The points curve up and then down.
Based on the residual plot shown, is a linear model appropriate for comparing driving speed and fuel efficiency?
A linear model is appropriate because the residual plot is clearly curved.
A linear model is not appropriate because the residual plot shows a clear pattern.
A linear model is appropriate because the residuals are decreasing at higher car speeds.
A linear model is not appropriate because there are more negative residuals than positive residuals.

Answers: 1


Other questions on the subject: Mathematics
Mathematics, 20.06.2019 18:04, jamilecalderonpalaci
Given that (x-3) is a factor of f(x)=x^3+ax^2-x-6, find a and hence the number of real roots or the equation f(x)=0
Answers: 3
Mathematics, 21.06.2019 20:10, dashawn3rd55
Over which interval is the graph of f(x) = x2 + 5x + 6 increasing?
Answers: 1
Mathematics, 21.06.2019 20:30, psychocatgirl1
Answer asap evaluate 4-0.25g+0.5h4−0.25g+0.5h when g=10g=10 and h=5h=5.
Answers: 3
You know the right answer?
Many new cars provide detailed information about engine performance on the dashboard. One such featu...
Questions in other subjects:


Biology, 24.03.2020 20:04

Social Studies, 24.03.2020 20:04

Mathematics, 24.03.2020 20:04


