
Mathematics, 07.04.2021 20:00 geraldmorgan5580
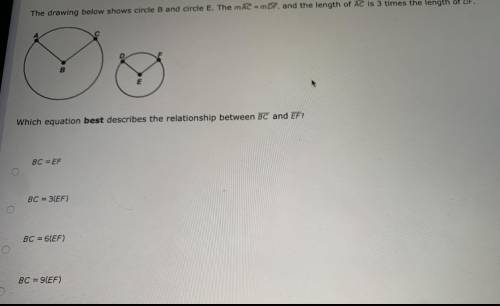
The drawing below shows circle B and circle E. Which equation best describes the relationship between BC and EF?

Answers: 3


Other questions on the subject: Mathematics
Mathematics, 21.06.2019 16:30, trillralyn4060
Rectangle pqrs has length a and width 4b. the x-axis bisects ps and qr what are the coordinates of the vertices
Answers: 2
Mathematics, 21.06.2019 18:00, evarod
The given dot plot represents the average daily temperatures, in degrees fahrenheit, recorded in a town during the first 15 days of september. if the dot plot is converted to a box plot, the first quartile would be drawn at __ , and the third quartile would be drawn at link to the chart is here
Answers: 1
Mathematics, 21.06.2019 19:00, dfrtgyuhijfghj4794
Since opening night, attendance at play a has increased steadily, while attendance at play b first rose and then fell. equations modeling the daily attendance y at each play are shown below, where x is the number of days since opening night. on what day(s) was the attendance the same at both plays? what was the attendance? play a: y = 8x + 191 play b: y = -x^2 + 26x + 126 a. the attendance was never the same at both plays. b. the attendance was the same on day 5. the attendance was 231 at both plays on that day. c. the attendance was the same on day 13. the attendance was 295 at both plays on that day. d. the attendance was the same on days 5 and 13. the attendance at both plays on those days was 231 and 295 respectively.
Answers: 1
Mathematics, 21.06.2019 21:00, kharmaculpepper
Joanie watched 1 out of three of a movie in the morning
Answers: 1
You know the right answer?
The drawing below shows circle B and circle E. Which equation best describes the relationship betwee...
Questions in other subjects:

Mathematics, 24.04.2020 18:22
Business, 24.04.2020 18:22


Mathematics, 24.04.2020 18:22


