
Mathematics, 07.04.2021 19:30 elijaahstepp041
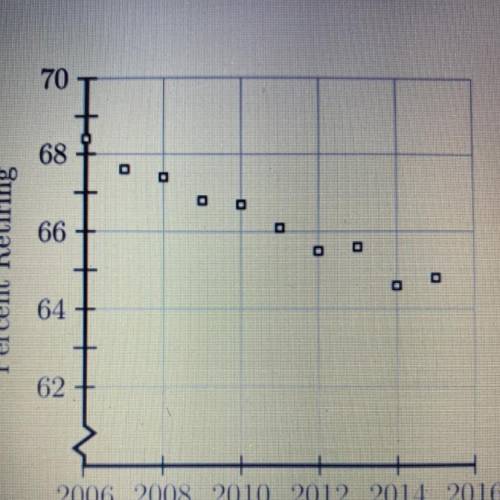
The scatterplot shown below represent data for each of the years from 2006 to 2015. The plot shows the percent of people 62 years of age and older who were working and then retired during each of those years. If this trend continued, which if the following beat predicts the percent who retired in 2016?
A: 62%
B: 64%
C: 66%
D: 68%

Answers: 1


Other questions on the subject: Mathematics
Mathematics, 21.06.2019 18:00, Manglethemango9450
What is the solution to the equation in the & show work i’m very
Answers: 1
Mathematics, 21.06.2019 18:30, letsbestupidcx7734
Two cyclists 84 miles apart start riding toward each other at the samen time. one cycles 2 times as fast as the other. if they meet 4 hours later what is the speed (in miles) of the faster cyclists
Answers: 2
You know the right answer?
The scatterplot shown below represent data for each of the years from 2006 to 2015. The plot shows t...
Questions in other subjects:
Mathematics, 13.05.2021 09:50


Business, 13.05.2021 14:00

Biology, 13.05.2021 14:00
Mathematics, 13.05.2021 14:00


