
Mathematics, 07.04.2021 18:40 angelicar1160
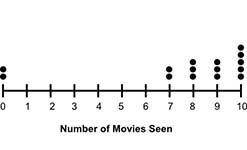
The dot plot shows the number of movies 15 people watched in a month:
Dot plot labeled Number of Movies Seen shows 2 dots over 0, 2 dots over 7, 3 dot over 8, 3 dots over 9, and 5 dots over 10.
Is the median or the mean a better center for this data and why?
Mean; because the data is normally distributed and has an outlier
Mean; because the data clusters on the right and is not symmetric
Median; because the data is normally distributed and has an outlier
Median; because the data clusters on the right and is not symmetric

Answers: 3


Other questions on the subject: Mathematics
Mathematics, 21.06.2019 21:30, kalieghcook
If t17 = 3 (t5) in an arithmetic progression, find t1 in terms of d.
Answers: 1
Mathematics, 22.06.2019 00:40, ggg509
Atest consists of 10 multiple choice questions, each with 5 possible answers, one of which is correct. to pass the test a student must get 60% or better on the test. if a student randomly guesses, what is the probability that the student will pass the test?
Answers: 2
You know the right answer?
The dot plot shows the number of movies 15 people watched in a month:
Dot plot labeled Number of Mo...
Questions in other subjects:
Mathematics, 29.05.2020 23:02
Mathematics, 29.05.2020 23:02


