
Mathematics, 06.04.2021 20:20 lovejennaaj
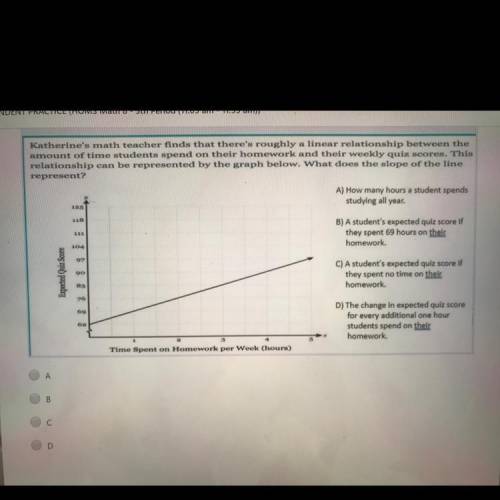
Katherine's math teacher finds that there's roughly a linear relationship between the
amount of time students spend on their homework and their weekly quiz scores. This
relationship can be represented by the graph below. What does the slope of the line
represent?

Answers: 1


Other questions on the subject: Mathematics
Mathematics, 21.06.2019 14:40, beebeck6573
Chose the graph below that represents the following system of inequality’s
Answers: 2
Mathematics, 21.06.2019 19:30, Robloxdemonduckyt
Піf x = y and y= z, which statement must be true? оа. -x = -2 b. x= z ос. —x = 2 od. 2= x
Answers: 3
Mathematics, 21.06.2019 21:00, kaylaamberd
What is the value of m in the equation 1/2 m - 3/4n=16 when n=8
Answers: 1
You know the right answer?
Katherine's math teacher finds that there's roughly a linear relationship between the
amount of tim...
Questions in other subjects:
Mathematics, 27.06.2020 02:01

English, 27.06.2020 02:01
Mathematics, 27.06.2020 02:01


Mathematics, 27.06.2020 02:01


