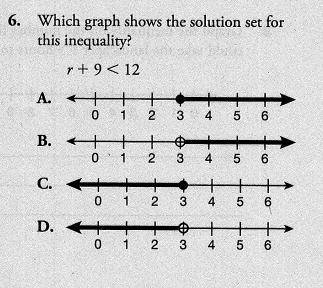
Which graph shows the solution set for this inequality r + 9 < 12
...

Mathematics, 06.04.2021 19:20 ilovecatsomuchlolol
Which graph shows the solution set for this inequality r + 9 < 12

Answers: 2


Other questions on the subject: Mathematics
Mathematics, 21.06.2019 13:30, rhiannonweik2000
Which of the following lines is not parallel to the graph of y = 4x +7?
Answers: 1
Mathematics, 21.06.2019 14:00, AnaiyaKirksey8
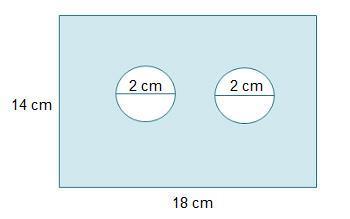
Find the area of a trapezoid with bases 14 cm and 18 cm and height 10 cm. 160 cm2 140 cm2 180 cm2 126 cm2
Answers: 3
Mathematics, 21.06.2019 16:20, bestballer7095
Aclass consists of 55% boys and 45% girls. it is observed that 25% of the class are boys and scored an a on the test, and 35% of the class are girls and scored an a on the test. if a student is chosen at random and is found to be a girl, the probability that the student scored an ais
Answers: 2
Mathematics, 21.06.2019 18:00, santosv3136
What are the equivalent ratios for 24/2= /3= /5.5=108/ = /15
Answers: 1
You know the right answer?
Questions in other subjects:


Mathematics, 21.10.2020 19:01
History, 21.10.2020 19:01


