
Mathematics, 06.04.2021 18:00 yadirahurtado4444
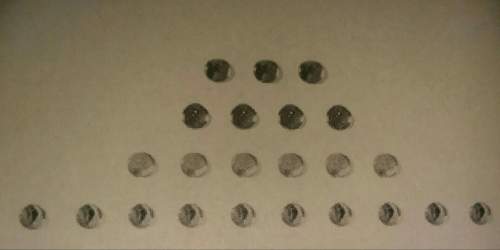
This diagram shows four small squares and one rectangle composed of 10 small squares.
Diagram of 4 small squares and one rectangle composed of 10 small squares.
a. Andre says that this diagram can represent 140.
Do you agree with Andre?
Explain why or why not.
Type your response in the space below.
b. What is another value this diagram could represent? How do you know?
Type your response in the space below.


Answers: 3


Other questions on the subject: Mathematics
Mathematics, 21.06.2019 17:00, beautycutieforever10
Evaluate the expression for the given value of the variable. 5×(h+3) for h=7
Answers: 1
Mathematics, 22.06.2019 02:10, Tcareyoliver
Overproduction of uric acid in the body can be an indication of cell breakdown. this may be an advance indication of illness such as gout, leukemia, or lymphoma.† over a period of months, an adult male patient has taken nine blood tests for uric acid. the mean concentration was x = 5.35 mg/dl. the distribution of uric acid in healthy adult males can be assumed to be normal, with σ = 1.87 mg/dl. (a) find a 95% confidence interval for the population mean concentration of uric acid in this patient's blood. what is the margin of error? (round your answers to two decimal places.) lower limit upper limit margin of error (b) what conditions are necessary for your calculations? (select all that apply.) σ is unknown n is large σ is known normal distribution of uric acid uniform distribution of uric acid (c) interpret your results in the context of this problem. there is not enough information to make an interpretation. the probability that this interval contains the true average uric acid level for this patient is 0.05. the probability that this interval contains the true average uric acid level for this patient is 0.95. there is a 95% chance that the confidence interval is one of the intervals containing the population average uric acid level for this patient. there is a 5% chance that the confidence interval is one of the intervals containing the population average uric acid level for this patient. (d) find the sample size necessary for a 95% confidence level with maximal margin of error e = 1.10 for the mean concentration of uric acid in this patient's blood. (round your answer up to the nearest whole number.) blood tests
Answers: 2
Mathematics, 22.06.2019 03:10, rafi10
Suppose that a customer is purchasing a car. he conducts an experiment in which he puts 10 gallons of gas in the car and drives it until it runs out of gas. he conducts this experiment 15 times on each car and records the number of miles driven. full data set car 1 238238 216216 205205 212212 240240 274274 297297 252252 260260 247247 257257 243243 296296 243243 290290 car 2 245245 204204 215215 209209 251251 165165 221221 295295 172172 287287 268268 305305 320320 260260 297297 describe each data set, that is determine the shape, center, and spread. sample mean for car 1 x overbar equalsx=216216 mi / 10 gal (type an integer or decimal rounded to one decimal place as needed.) sample mean for car 2 x overbar equalsx=209209 mi / 10 gal (type an integer or decimal rounded to one decimal place as needed.)
Answers: 1
You know the right answer?
This diagram shows four small squares and one rectangle composed of 10 small squares.
Diagram of 4...
Questions in other subjects:
Mathematics, 16.10.2020 20:01
Engineering, 16.10.2020 20:01

Mathematics, 16.10.2020 20:01


Mathematics, 16.10.2020 20:01


