
Mathematics, 06.04.2021 03:40 jamesmcfarland
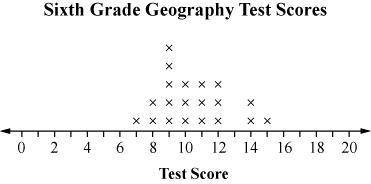
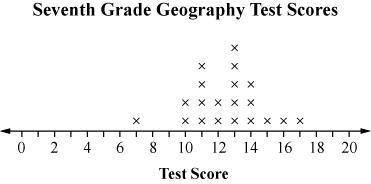
Ms. Leeper gives her sixth- and seventh-grade students a geography test to decide who will represent her class in the school geography bee. The line plots below show the results of the test for her sixth-grade class and seventh-grade class, respectively.
The data for each grade have the same interquartile range (IQR). Which of the following best compares the two test score distributions?
A - The median score of the seventh-grade class is 2 points greater than the median score of the sixth-grade class. This difference is the same as the IQR.
B - The median score of the seventh-grade class is 2 points greater than the median score of the sixth-grade class. This difference is twice as much as the IQR.
C - The median score of the seventh-grade class is 3 points greater than the median score of the sixth-grade class. This difference is the same as the IQR.
D - The median score of the seventh-grade class is 3 points greater than the median score of the sixth-grade class. This difference is twice as much as the IQR.

Answers: 2


Other questions on the subject: Mathematics
Mathematics, 21.06.2019 15:30, southerntouch103
Gretchen is setting up for a banquet. she has 300 chairs and needs to distribute them evenly among t tables. how many chairs should she put at each table? write your answer as an expression.
Answers: 2
Mathematics, 21.06.2019 17:30, chloerodgers56
In a probability experiment, karen flipped a coin 76 times. the coin landed on heads 32 times. what percentage of the coin flips resulted in tails? round to the nearest percent. a. 58% b. 65% c. 42% d. 60%
Answers: 2
Mathematics, 21.06.2019 20:00, faithyholcomb
Someone answer asap for ! max recorded the heights of 500 male humans. he found that the heights were normally distributed around a mean of 177 centimeters. which statements about max’s data must be true? a. the median of max’s data is 250 b. more than half of the data points max recorded were 177 centimeters. c. a data point chosen at random is as likely to be above the mean as it is to be below the mean. d. every height within three standard deviations of the mean is equally likely to be chosen if a data point is selected at random.
Answers: 1
Mathematics, 21.06.2019 21:00, ballbritez
Which line is parallel to the line that passes through the points (2, –5) and (–4, 1) a. y=-x+5 b. y=-2/3x+3 c. y=2/3x-2 d. y=x+5
Answers: 2
You know the right answer?
Ms. Leeper gives her sixth- and seventh-grade students a geography test to decide who will represent...
Questions in other subjects:

Geography, 02.12.2021 18:50
Mathematics, 02.12.2021 18:50


Chemistry, 02.12.2021 18:50
Geography, 02.12.2021 18:50


