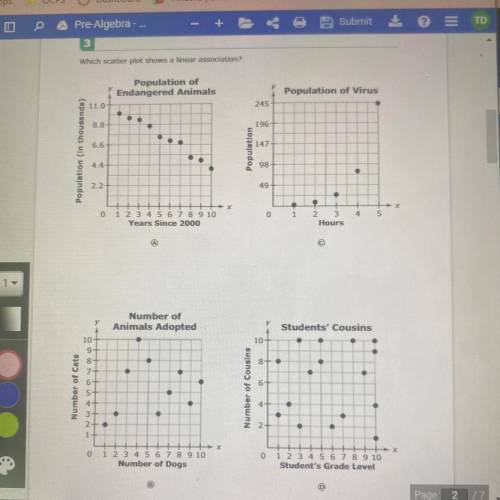
Which scatter plot shows a linear association!
Population of
Endangered Animals
Populat...

Mathematics, 05.04.2021 21:00 hannahbrown802
Which scatter plot shows a linear association!
Population of
Endangered Animals
Population of Virus
110
245
.
8.8
196
6.6
147
Population (in thousands)
Population
4.4
22
49
0
1
4
0 1 2 3 4 5 6 7 8 9 10
Years Since 2000
2 3
Hours
Number of
Animals Adopted
Students' Cousins
10
10
9
8.
74
6
5
6
Number of Cats
Number of Cousins
.
2
.
2
1
1 2 3 4 5 6 7 8 9 10
Number of Dogs
0 1 2 3 4 5 6 7 8 9 10
Student's Grade Level

Answers: 1


Other questions on the subject: Mathematics
You know the right answer?
Questions in other subjects:

Chemistry, 15.12.2021 06:50

Biology, 15.12.2021 06:50

History, 15.12.2021 06:50
History, 15.12.2021 06:50

Social Studies, 15.12.2021 06:50
History, 15.12.2021 06:50


