Which graph represents the solution
of the inequality below?
-1.2x - 6.5x < 2.3x + 5
...

Mathematics, 05.04.2021 03:50 zakwanasim123
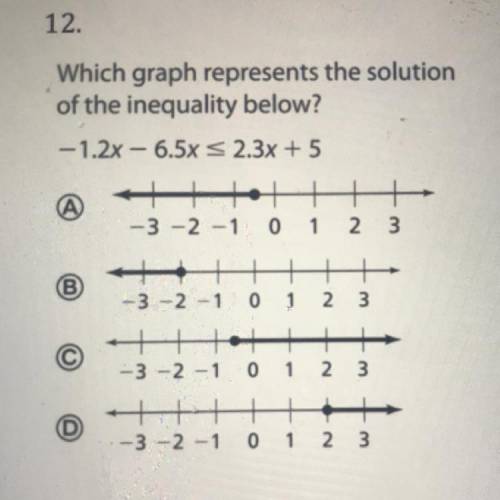
Which graph represents the solution
of the inequality below?
-1.2x - 6.5x < 2.3x + 5
-3 -2 -1 0 1 2 3
B
-3 -2 -1 0 1
2
3
+
3 -2 -1 0 1 2 3
-3 -2 -1 0 1 2
3

Answers: 3


Other questions on the subject: Mathematics
Mathematics, 21.06.2019 16:00, Spoiledgirl2905
Explain step-by-step how to simplify -5(2x – 3y + 6z – 10).
Answers: 2
You know the right answer?
Questions in other subjects:
Mathematics, 16.01.2021 02:10
Mathematics, 16.01.2021 02:10
Mathematics, 16.01.2021 02:10
Mathematics, 16.01.2021 02:10

Mathematics, 16.01.2021 02:10
Mathematics, 16.01.2021 02:10

Mathematics, 16.01.2021 02:10


