1. y 315.67% + 8986.5
-0.951
4.000
3.500
.
3.000
2.500
2.000
1.500
1.000
18 19 20 21 22 23 24 25
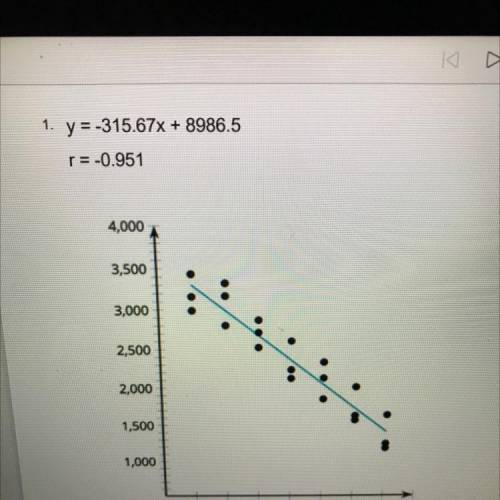
Twenty-one young men got a quote for the cost of a car insurance policy. The policy cost
and ages of the men are shown in the scatter plot. Select the TWO statements that are
true based on the scatter plot.
Pick up to 2 answers
A Every 19-year-old in this group has a lower cost of car insurance than the 18-year-
olds.
B Car Insurance policy cost tends to decrease as age of the driver increases.
C. The value of the correlation coefficient is very close to -1, so there is no association
between age and car insurance policy cost.
D. The line of best fit indicates that, in general, the cost of a car insurance policy for a
21-year-old should be on average, about $315 less than the cost of a car insurance
policy for a 20-year-old
E The intercept from the line of best fit indicates that, if the linear trend holds, a car
insurance policy would be $0 for a person who is about 8,987 years old.
The length of a rectangle plus its width is 25 cm. the area is 156 square cm. what are the length and width of the rectangle? separate the answers with a comma.