
Mathematics, 02.04.2021 17:30 afoakwacosmos
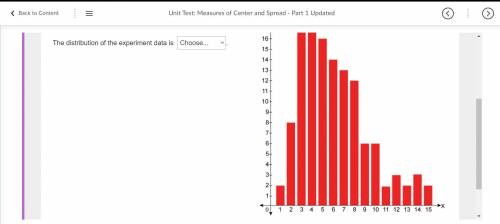
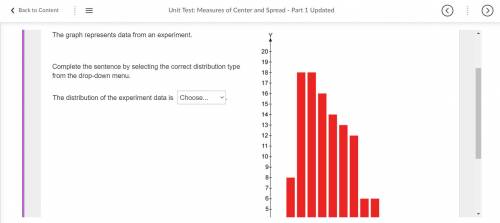
The graph represents data from an experiment.
Complete the sentence by selecting the correct distribution type from the drop-down menu.
The distribution of the experiment data is
Choose...
A) Normal
B) Uniform
C) Skewed Right
D) Skewed Left
I included 2 pictures because I couldn't fit the whole thing so it's the top of it and the bottom.

Answers: 2


Other questions on the subject: Mathematics
Mathematics, 21.06.2019 13:20, allicat133
Given the following statements, which is the best
Answers: 2
Mathematics, 21.06.2019 15:40, rhiannonwheatcr4468
36 inches/second = yards/minute how many yards?
Answers: 1
Mathematics, 21.06.2019 20:30, Travisbennington
Three numbers x, y, and z are in the ratio 2: 7: 8. if 12 is subtracted from y, then three numbers form a geometric sequence (in the order x, y–12, z). find x, y, and z. there are 2 sets.
Answers: 1
You know the right answer?
The graph represents data from an experiment.
Complete the sentence by selecting the correct distri...
Questions in other subjects:


History, 29.10.2021 16:40

Physics, 29.10.2021 16:40

Business, 29.10.2021 16:40

Mathematics, 29.10.2021 16:40


