
Mathematics, 02.04.2021 16:50 Amholloway13
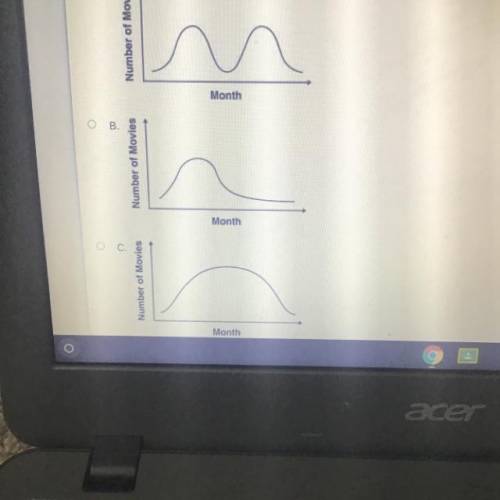
The table displays the number of movies a family watched per month over a one year period
Jan-1
Feb-2
Mar-2
Apr-3
May-4
Jun-6
Jul-7
Aug-4
Sep-3
Oct-2
Nov-2
Dec-1
Which curve most resembles the distribution of this data?

Answers: 3


Other questions on the subject: Mathematics
Mathematics, 21.06.2019 22:50, tali2561
Aclassroom is made up of 11 boys and 14 girls. the teacher has four main classroom responsibilities that she wants to hand out to four different students (one for each of the four students). if the teacher chooses 4 of the students at random, then what is the probability that the four students chosen to complete the responsibilities will be all boys?
Answers: 1
Mathematics, 21.06.2019 23:50, Angel4345
Astudent draws two parabolas both parabolas cross the x axis at (-4,0) and (6,0) the y intercept of the first parabolas is (0,-12). the y intercept of the second parabola is (0,-24) what is the positive difference between the a values for the two functions that describe the parabolas
Answers: 3
Mathematics, 22.06.2019 00:00, omar2334
Me with this assignment ! i only partially understand, so explain. also it's a work sample. at the championship bike race, steve and paula were fighting for first place. steve was 175 feet ahead of paula and had only 300 feet left to go. he was very tired and was going only 9 feet per second. paula was desperate to catch up and was going 15 feet per second. who won the bike race and by how far did she/he win?
Answers: 1
You know the right answer?
The table displays the number of movies a family watched per month over a one year period
Jan-1
Questions in other subjects:

Social Studies, 27.09.2019 03:50


Spanish, 27.09.2019 03:50


Physics, 27.09.2019 03:50

English, 27.09.2019 03:50


