A scatter plot is shown:
7
10 1
2
5
7
8 9 10
What type of assoc...

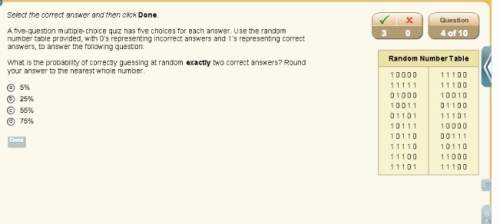
Mathematics, 02.04.2021 06:40 hammonangelo25
A scatter plot is shown:
7
10 1
2
5
7
8 9 10
What type of association does the graph show between x and y? (4 points)
O a
Linear positive association
Oь
Nonlinear positive association
Ос
Linear negative association
Od
Nonlinear negative association

Answers: 2


Other questions on the subject: Mathematics
Mathematics, 21.06.2019 20:00, jortizven0001
Seymour is twice as old as cassandra. if 16 is added to cassandra’s age and 16 is subtracted from seymour’s age, their ages become equal. what are their present ages? show !
Answers: 1
Mathematics, 22.06.2019 01:20, lauretta
Aprobability experiment is conducted in which the sample space of the experiment is s={7,8,9,10,11,12,13,14,15,16,17,18 }, event f={7,8,9,10,11,12}, and event g={11,12,13,14}. assume that each outcome is equally likely. list the outcomes in f or g. find p(f or g) by counting the number of outcomes in f or g. determine p(f or g) using the general addition rule.
Answers: 2
Mathematics, 22.06.2019 01:30, therealpr1metime45
Classify the following number. −9.070707…
Answers: 1
You know the right answer?
Questions in other subjects:


Chemistry, 25.02.2022 04:50
Mathematics, 25.02.2022 04:50

Computers and Technology, 25.02.2022 04:50

Social Studies, 25.02.2022 04:50
Mathematics, 25.02.2022 04:50


