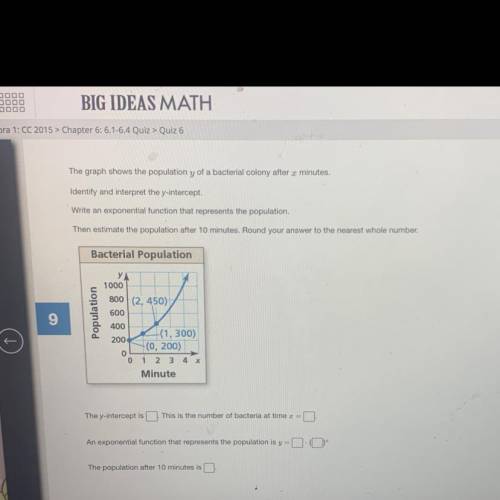
The graph shows the population y of a bacterial colony after a minutes.
Identify and int...

Mathematics, 01.04.2021 21:40 mikkilynnpeace1982
The graph shows the population y of a bacterial colony after a minutes.
Identify and interpret the y-intercept.
Write an exponential function that represents the population.
Then cstimate the population after 10 minutes. Round your answer to the nearest whole number.
(picture on top)
The y-Intercept is _
This is the number of bacteria at time I = _
An exponential function that represents the population is y= ___ • (___)x^
The population after 10 minutes is _
PLS HELP ILL GIVE BRAINIEST and give many likes on my different accounts,
no guessing or will report.

Answers: 2


Other questions on the subject: Mathematics
Mathematics, 21.06.2019 19:10, jemseidle8889
Click an item in the list or group of pictures at the bottom of the problem and, holding the button down, drag it into the correct position in the answer box. release your mouse button when the item is place. if you change your mind, drag the item to the trashcan. click the trashcan to clear all your answers. solve this quadratic equation using the quadratic formula. 2x2 - 2x=1 need asap
Answers: 2
Mathematics, 21.06.2019 21:30, swordnewsnetwork
Which of the following disjunctions is true? 4 + 4 = 16 or 6 - 5 = 11 4 · 3 = 7 or 3 - 2 = 5 8 - 5 = 13 or 7 · 2 = 12 7 - 4 = 11 or 6 + 3 = 9
Answers: 1
You know the right answer?
Questions in other subjects:

French, 21.04.2021 22:00

Mathematics, 21.04.2021 22:00
Mathematics, 21.04.2021 22:00

Mathematics, 21.04.2021 22:00


