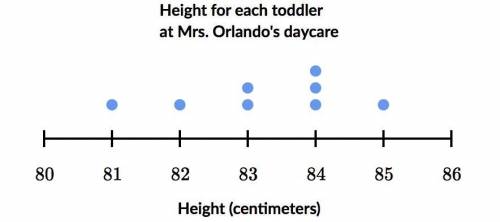
Find the interquartile range (IQR) of the data in the dot plot below.
...

Mathematics, 01.04.2021 18:50 emurray
Find the interquartile range (IQR) of the data in the dot plot below.

Answers: 1


Other questions on the subject: Mathematics
Mathematics, 21.06.2019 17:30, 21villalobosjabez
Trent wants to buy 2 packs of trading cards for 3 dollars each. the trading card packs that trent normally buys tend to come in packs of 6, 10, 12, or 15 cards. after selecting 2 packs, trent found that the first pack of cards cost 25 cents per card, and the second pack cost 30 cents per card. trent uses this information to write the equations below in order to compare c, the number of cards in each pack.
Answers: 2
Mathematics, 21.06.2019 17:50, MrKrinkle77
Segment ab is shown on the graph. which shows how to find the x-coordinate of the point that will divide ab into a 2: 3 ratio using the formula
Answers: 2
Mathematics, 21.06.2019 18:00, puppylover72
Solve this and show you’re work step by step ! -5 3/4+3h< 9 1/4 -
Answers: 1
Mathematics, 21.06.2019 22:00, ashuntihouston14
If the altitude is drawn to the hypotenuse of a right triangle, then the two triangles formed are similar to the original triangle and to each other. which set of triangles shows the similar triangles created by the altitude in the diagram?
Answers: 3
You know the right answer?
Questions in other subjects:

Arts, 19.01.2021 17:20


Social Studies, 19.01.2021 17:20

English, 19.01.2021 17:20
Mathematics, 19.01.2021 17:20

Mathematics, 19.01.2021 17:20
Mathematics, 19.01.2021 17:20


