
Mathematics, 01.04.2021 18:30 brillamontijo
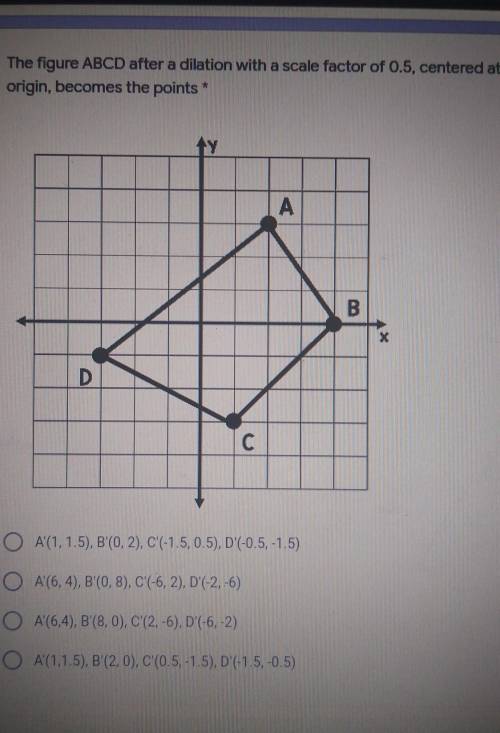
The figure ABCD after a dilation with a scale factor of 0.5, centered at the origin, becomes the points A B C D
O A'(1,1.5), B'(0, 2), C'(-1.5, 0.5), D'(-0.5, -1.5)
O A' (6,4), B'(0,8), C'(-6,2), D'(-2,-6)
O A'(6,4), B (8,0), C (2,-6). D'(-6, -2)
O A'(1,1,5), B (2.0), C (0.5, -1.5), D'(-1.5, -0.5)

Answers: 1


Other questions on the subject: Mathematics
Mathematics, 21.06.2019 17:30, milkshakegrande101
Which of the following tables represents exponential functions?
Answers: 1
Mathematics, 21.06.2019 20:00, faithyholcomb
Someone answer asap for ! max recorded the heights of 500 male humans. he found that the heights were normally distributed around a mean of 177 centimeters. which statements about max’s data must be true? a. the median of max’s data is 250 b. more than half of the data points max recorded were 177 centimeters. c. a data point chosen at random is as likely to be above the mean as it is to be below the mean. d. every height within three standard deviations of the mean is equally likely to be chosen if a data point is selected at random.
Answers: 1
Mathematics, 21.06.2019 20:30, dominaricann2451
When you have 25 numbers, and jake picks 3 random numbers and puts them back, what is the chance bob has of picking those 3 numbers when he picks 6 random numbers (without putting them back)? explain.
Answers: 1
You know the right answer?
The figure ABCD after a dilation with a scale factor of 0.5, centered at the origin, becomes the poi...
Questions in other subjects:
Mathematics, 18.06.2020 01:57
Mathematics, 18.06.2020 01:57

History, 18.06.2020 01:57
Mathematics, 18.06.2020 01:57
Mathematics, 18.06.2020 01:57


