
Mathematics, 01.04.2021 17:50 kayleebueno
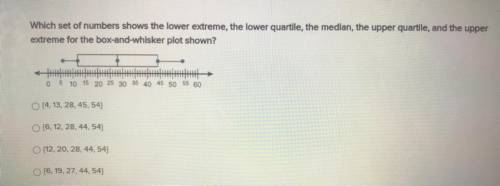
Which set of numbers shows the lower extreme, the lower quartile, the median, the upper quartile, and the upper
extreme for the box-and-whisker plot shown?
(14, 13, 28, 45, 54)
(6,12, 28, 44, 54)
(12, 20, 28, 44, 54)
Will give
Please help me
(6,19,27, 44,54)

Answers: 3


Other questions on the subject: Mathematics
Mathematics, 21.06.2019 15:00, rebelprincezz5785
Asmall foreign car gete 42 miles per gallon and user 35 gallons on a trip. gasoline costs $1.05 per gallon. what was the cost of gasoline per mile driver?
Answers: 3
Mathematics, 21.06.2019 18:30, 420420blazee
You were told that the amount of time lapsed between consecutive trades on the new york stock exchange followed a normal distribution with a mean of 15 seconds. you were also told that the probability that the time lapsed between two consecutive trades to fall between 16 to 17 seconds was 13%. the probability that the time lapsed between two consecutive trades would fall below 13 seconds was 7%. what is the probability that the time lapsed between two consecutive trades will be between 14 and 15 seconds?
Answers: 3
Mathematics, 21.06.2019 21:50, neirabrandon516
Question 14 (1 point) larry deposits $15 a week into a savings account. his balance in his savings account grows by a constant percent rate.
Answers: 3
You know the right answer?
Which set of numbers shows the lower extreme, the lower quartile, the median, the upper quartile, an...
Questions in other subjects:
Mathematics, 15.04.2021 19:50

Business, 15.04.2021 19:50
Mathematics, 15.04.2021 19:50

History, 15.04.2021 19:50


Mathematics, 15.04.2021 19:50


