The tree diagram represents an
experiment consisting of two trials.
.3
.4
B...

Mathematics, 01.04.2021 15:40 Queenashley3232
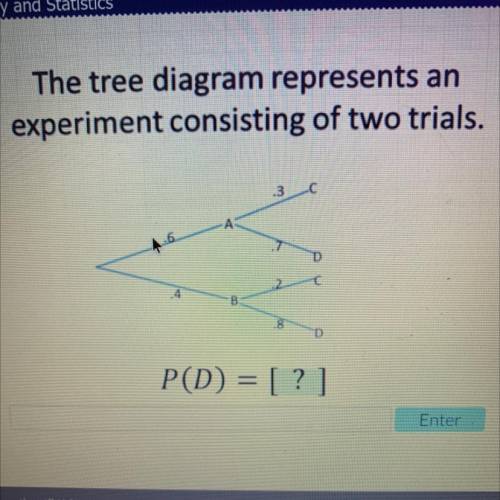
The tree diagram represents an
experiment consisting of two trials.
.3
.4
B

Answers: 2


Other questions on the subject: Mathematics
Mathematics, 22.06.2019 04:30, acharity196
Out of the 150 students at a summer camp, 72 signed up for canoeing. there were 23 students who signed up for trekking, and 13 of those students also signed up for canoeing. use a two-way table to organize the information and answer the following question: approximately what percentage of students signed up for neither canoeing nor trekking?
Answers: 3
Mathematics, 22.06.2019 05:30, babysune01
Multiple questions for same graphwhat is the range of the set of data this box-and-whisker plot represents? 36810what is the interquartile range of the set of data this box-and-whisker plot represents? 36810
Answers: 1
You know the right answer?
Questions in other subjects:
Mathematics, 29.11.2021 19:00

Chemistry, 29.11.2021 19:00
Mathematics, 29.11.2021 19:00
Mathematics, 29.11.2021 19:00


Biology, 29.11.2021 19:00


