30 points Please help
(06.01 MC)
The scatter plot shows the relationship between the test sco...

Mathematics, 31.03.2021 20:20 shartiarahoward
30 points Please help
(06.01 MC)
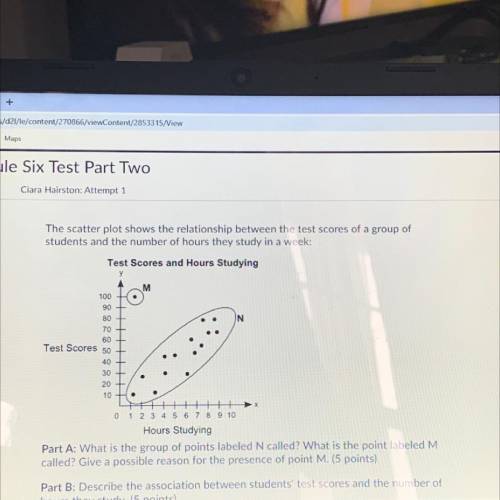
The scatter plot shows the relationship between the test scores of a group of
students and the number of hours they study in a week:
PART A: What is the group of points labeled N called? What is the point labeled M called? Give a possible reason for the presence of point M.
PART B: Describe the association between students test scores and the number of hours they study.

Answers: 2


Other questions on the subject: Mathematics
Mathematics, 21.06.2019 18:30, Katlyndavis01
What is the answer to this question? i'm a bit stumped. also how do i do it? 5(x - 4) = 2(x + 5)
Answers: 1
Mathematics, 21.06.2019 20:30, jonmorton159
Aword processing program requires a 7- digit registration code made up of the digits 1,2,4,5,6,7 and 9 each number has to be used and no number can be used mor than once how many codes are possible
Answers: 1
Mathematics, 22.06.2019 01:30, michaela134
Aresearch study is done to find the average age of all u. s. factory workers. the researchers asked every factory worker in ohio what their birth year is. this research is an example of a census survey convenience sample simple random sample
Answers: 3
You know the right answer?
Questions in other subjects:


Spanish, 05.05.2020 19:28
English, 05.05.2020 19:28


