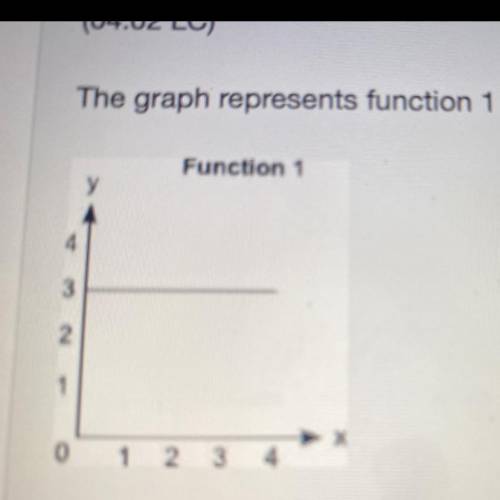
The graph represents function 1 and the equation represents function 2:
Function 1
See image...

Mathematics, 31.03.2021 16:50 Savageboyn
The graph represents function 1 and the equation represents function 2:
Function 1
See image below for function 1
Function 2
y = 2x + 1
How much more is the rate of change of function 2 than the rate of change of function 1?
1
2
3
4

Answers: 1


Other questions on the subject: Mathematics
Mathematics, 21.06.2019 13:50, daytonalive7193
Asimple random sample of size nequals14 is drawn from a population that is normally distributed. the sample mean is found to be x overbar equals 70 and the sample standard deviation is found to be sequals13. construct a 90% confidence interval about the population mean
Answers: 2
Mathematics, 21.06.2019 18:00, whocares1234
How many triangles can be drawn with side lengths 4 centimeters, 4.5 centimeters, and 9 centimeters? explain
Answers: 1
You know the right answer?
Questions in other subjects:


Mathematics, 01.07.2021 16:20

Mathematics, 01.07.2021 16:20
Mathematics, 01.07.2021 16:20


