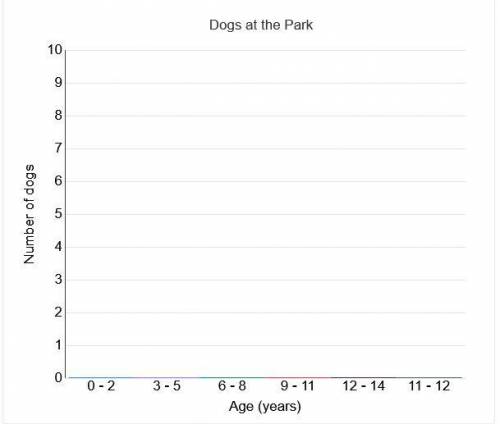
The data shows the age of eight different dogs at a dog park.
3, 3, 7, 2, 4, 8, 10, 8
C...

Mathematics, 31.03.2021 02:10 powellalyvia
The data shows the age of eight different dogs at a dog park.
3, 3, 7, 2, 4, 8, 10, 8
Create a histogram of this data.
To create a histogram, hover over each age range on the x-axis. Then click and drag up to plot the data.


Answers: 1


Other questions on the subject: Mathematics


Mathematics, 21.06.2019 23:00, kealalac1
Afunction, f(x), represents the height of a plant x months after being planted. students measure and record the height on a monthly basis. select the appropriate domain for this situation. a. the set of all positive real numbers b. the set of all integers oc. the set of all positive integers od. the set of all real numbers reset next
Answers: 3
You know the right answer?
Questions in other subjects:


Chemistry, 11.03.2021 04:00


English, 11.03.2021 04:00

Physics, 11.03.2021 04:00


Arts, 11.03.2021 04:00


