
Mathematics, 30.03.2021 23:50 bbrogle5154
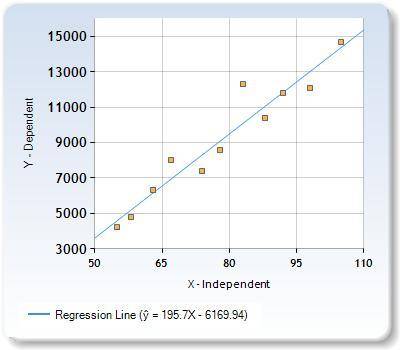
The IRS wants to develop a method for detecting whether or not individuals have overstated their deductions for charitable contributions on their tax returns. To assist in this effort, the IRS supplied data found in the file IRS. xlsx that accompanies this book listing the adjusted gross income (AGI) and charitable contributions for 11 taxpayers whose returns were audited and found to be correct.
Required:
a. Prepare a scatter plot of the data. Does there appear to be a linear relationship between these variables?
b. Develop a simple linear regression model that can be used to predict the level of charitable contributions from a return's AGI. What is the estimated regression equation?
c. Interpret the value of R2.
d. How might the IRS use the regression results to identify returns with unusually high charitable contributions?

Answers: 3


Other questions on the subject: Mathematics
Mathematics, 21.06.2019 14:30, Ezasha
Will mark brainliest with 20 points! the table shows how far object 1 traveled as a function of time. *time (seconds) - 2 4 6 8 *distance traveled (feet) - 18 36 54 72 the equation shows how far object 2 traveled in feet as a function of time in minutes. *f(x) = 10x which object traveled at a faster speed? justify your response.
Answers: 1
Mathematics, 21.06.2019 16:00, pringleosmond
65 8 7 4 5 6 8 4 3 2 1 9 5 6 4 2 1 6 5 1 5 1 3 2 3 5 multiply the third number in the first row by the seventh number in the third row. add this result to the fifth number in the second row. add to this total ten times the fourth number in the third row. subtract the eighth number in the first row from the result.
Answers: 3
You know the right answer?
The IRS wants to develop a method for detecting whether or not individuals have overstated their ded...
Questions in other subjects:
Mathematics, 05.02.2021 03:40
Mathematics, 05.02.2021 03:40

Mathematics, 05.02.2021 03:40


Mathematics, 05.02.2021 03:40
Chemistry, 05.02.2021 03:40


