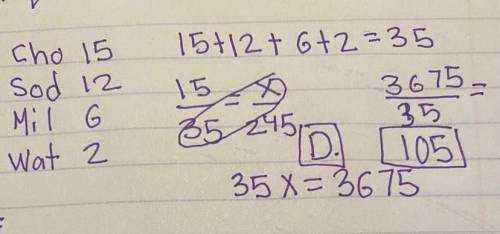
The table shows the results of a survey of seventh-grade students in the lunch-line
CHART:
Dri...

Mathematics, 30.03.2021 23:50 tabiannasmom2
The table shows the results of a survey of seventh-grade students in the lunch-line
CHART:
Drink / Students
Chocolate Milk / 15
Soda / 12
Milk / 6
Water / 2
If there are 245 seventh-graders in the school, how many can be expected to prefer chocolate milk?
A: 45
B: 84
C: 90
D: 105

Answers: 3


Other questions on the subject: Mathematics
Mathematics, 22.06.2019 00:20, Imagine2013
Given sin28.4=.4756, cos28.4=.8796, and tan28.4=.5407 find the cos of 61.6
Answers: 2
Mathematics, 22.06.2019 01:30, joytheqt305
Arecent study focused on the number of times men and women who live alone buy take-out dinner in a month. assume that the distributions follow the normal probability distribution and the population standard deviations are equal. the information is summarized below. statistic men women sample mean 24.85 21.33 sample standard deviation 5.54 4.93 sample size 34 36 at the 0.01 significance level, is there a difference in the mean number of times men and women order take-out dinners in a month? state the decision rule for 0.01 significance level: h0: μmen= μwomen h1: μmen ≠ μwomen. (negative amounts should be indicated by a minus sign. round your answers to 3 decimal places.) compute the value of the test statistic. (round your answer to 3 decimal places.) what is your decision regarding the null hypothesis? what is the p-value? (round your answer to 3 decimal places.)
Answers: 1
Mathematics, 22.06.2019 04:00, oscargonzalez1991
What is the sum of the measures of the interior angles of an octagon
Answers: 2
You know the right answer?
Questions in other subjects:
Mathematics, 16.06.2021 02:00


Mathematics, 16.06.2021 02:00
Mathematics, 16.06.2021 02:00
Biology, 16.06.2021 02:00


