
Mathematics, 30.03.2021 23:30 xrivas
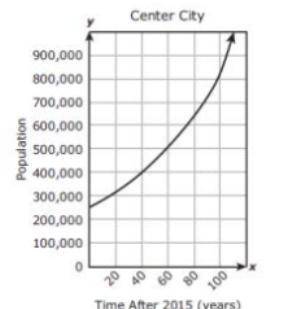
the population of center city is modeled by exponential function f, where x is the number of years after the year of 2015. the graph of f is shown on the grid. which inequality best represents the range of f in this situation?

Answers: 1


Other questions on the subject: Mathematics
Mathematics, 21.06.2019 16:30, dominickstrickland
The spring the owner of a sporting good store decreases the price of winter gloves from $10 to $8 each increases the price of swimming goggles from $8 to $10 without doing the math you think the percent decrease in the price of the gloves the same as the percent increase of the goggles explain why or why not
Answers: 1
You know the right answer?
the population of center city is modeled by exponential function f, where x is the number of years a...
Questions in other subjects:
Mathematics, 16.07.2019 22:30


Physics, 16.07.2019 22:30

Biology, 16.07.2019 22:30

Biology, 16.07.2019 22:30
Spanish, 16.07.2019 22:30


