
Mathematics, 30.03.2021 22:40 aaron2113
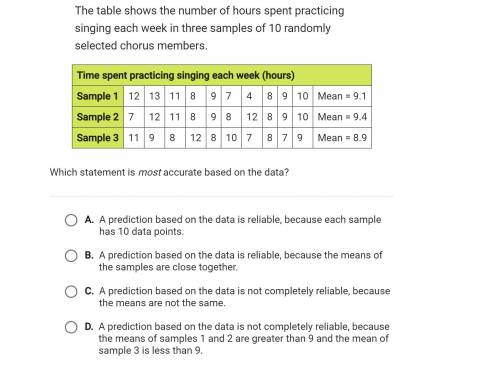
The table shows the number of hours spent practicing singing each week in three samples of 10 randomly selected chorus members.
Which statement is most accurate based on the data?
A). A prediction based on the data is reliable, because the means of
the samples are close together.
B). A prediction based on the data is reliable because each sample
has 10 data points.
C). A prediction based on the data is not completely reliable, because
the means are not the same.
D.) An predition based on the data is not completely reliable, because
the means of samples 1 and 2 are greater than 9 and the mean of
sample 3 is less than 9.

Answers: 3


Other questions on the subject: Mathematics
Mathematics, 21.06.2019 19:30, unknown337
Complete the synthetic division problem below. what is the quotient in polynomial form 2/16 -16
Answers: 3
Mathematics, 21.06.2019 19:30, danielahchf
Ineed with angles and the measure of them i have abc a is 65 and b is (3x-10) and c is (2x) find the value of x
Answers: 2
Mathematics, 21.06.2019 20:30, AllanCasey12
Angles r and s are complementary. the measure of angle r is 31 degrees. which equation can be used to find angle s?
Answers: 1
You know the right answer?
The table shows the number of hours spent practicing singing each week in three samples of 10 random...
Questions in other subjects:
Mathematics, 03.05.2020 13:21

Chemistry, 03.05.2020 13:21
Chemistry, 03.05.2020 13:21


Biology, 03.05.2020 13:21
Mathematics, 03.05.2020 13:21


History, 03.05.2020 13:21


