
Mathematics, 30.03.2021 22:00 estermartinez
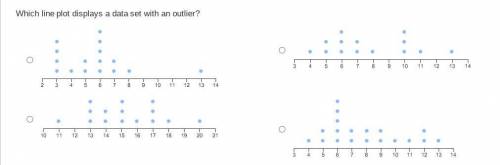
Which line plot displays a data set with an outlier?
An untitled line plot from 2 to 14. The plot displays the following values as dots above the corresponding value on the number line. Four dots at 3. One dot at 4. Two dots at 5. Five dots at 6. Two dots at 7. One dot at 8. One dot at 13.
An untitled line plot from 3 to 14. The plot displays the following values as dots above the corresponding value on the number line. One dot at 4. Two dots at 5. Three dots at 6. Two dots at 7. One dot at 8. Three dots at 10. One dot at 11. One dot at 13.
An untitled line plot from 10 to 21. The plot displays the following values as dots above the corresponding value on the number line. One dot at 11. Three dots at 13. Two dots at 14. Three dots at 15. One dot at 16. Three dots at 17. One dot at 18. One dot at 20.
An untitled line plot from 3 to 14. The plot displays the following values as dots above the corresponding value on the number line. One dot at 4. Two dots at 5. Five dots at 6. Two dots at 7. Two dots at 8. Two dots at 9. One dot at 10. One dot at 11. Two dots at 12. One dot at 13.

Answers: 1


Other questions on the subject: Mathematics
Mathematics, 21.06.2019 20:40, eddyjunior679
What is the probability of throwing several dice with sum equal to 6 (six)? show the ways of possibilities for sum 6 (as the numerator) and the ways of throwing n dices for n = 1, 2, 3, 4 or 5 as denominator for all the questions to earn full credits. (a)throw one die, (b) throw two dice, (c) throw three dice (d) throw 4 dice, (e) throw 5 dice
Answers: 3
You know the right answer?
Which line plot displays a data set with an outlier?
An untitled line plot from 2 to 14. The plot d...
Questions in other subjects:
Mathematics, 17.07.2019 13:50


History, 17.07.2019 13:50

Biology, 17.07.2019 13:50


