
Mathematics, 30.03.2021 17:50 whathelppp
Equations and Graphs of Exponential Functions
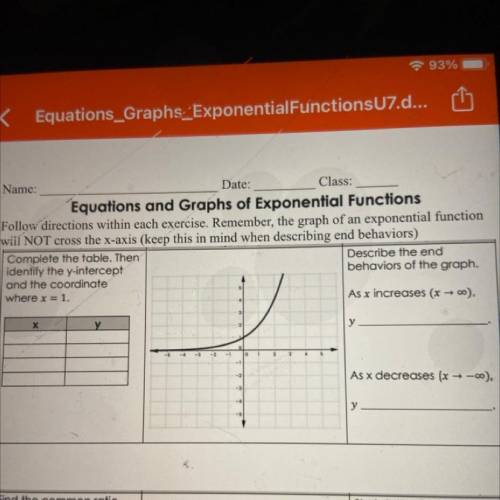
Follow directions within each exercise. Remember, the graph of an exponential function
will NOT cross the x-axis (keep this in mind when describing end behaviors)
Complete the table. Then
Describe the end
identify the y-intercept
behaviors of the graph.
and the coordinate
where x = 1.
As x increases (x )
х
у
y
-1
As x decreases (x →-0)
у

Answers: 1


Other questions on the subject: Mathematics
Mathematics, 21.06.2019 12:30, mikeeway33
Write the inverse of the logarithmic function used to represent the situation in model 1, f(x)=3+2in x . express the answer in radical form.
Answers: 1
Mathematics, 21.06.2019 17:00, hsernaykaw42
Use the frequency distribution, which shows the number of american voters (in millions) according to age, to find the probability that a voter chosen at random is in the 18 to 20 years old age range. ages frequency 18 to 20 5.9 21 to 24 7.7 25 to 34 20.4 35 to 44 25.1 45 to 64 54.4 65 and over 27.7 the probability that a voter chosen at random is in the 18 to 20 years old age range is nothing. (round to three decimal places as needed.)
Answers: 1
You know the right answer?
Equations and Graphs of Exponential Functions
Follow directions within each exercise. Remember, the...
Questions in other subjects:


Spanish, 12.11.2020 06:30


English, 12.11.2020 06:30


