
Mathematics, 30.03.2021 17:40 billydeck30
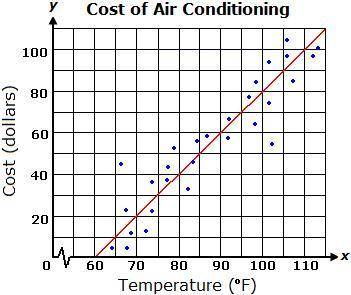
The graph shows a line of best fit for data collected on the cost of air conditioning as a function of the outside temperature.
Which equation represents the line of best fit?
A. y=2x-60
B. y=x-120
C. y=2x-120
D. y=x-60

Answers: 1


Other questions on the subject: Mathematics
Mathematics, 21.06.2019 12:30, charlybraun200094
The diagram shows a 7cm by 6cm rectangle based pyramid. all the diagonal sides - ta, tb, tc and td are length 10cm. m is midpoint of rectangular base. work out height mt to 1 decimal place
Answers: 1
Mathematics, 21.06.2019 16:30, taythestargazer71
What is the name used to describe a graph where for some value of x, there exists 2 or more different values of y?
Answers: 2
You know the right answer?
The graph shows a line of best fit for data collected on the cost of air conditioning as a function...
Questions in other subjects:

Mathematics, 29.12.2019 13:31

Social Studies, 29.12.2019 13:31

Mathematics, 29.12.2019 13:31

English, 29.12.2019 13:31
Mathematics, 29.12.2019 13:31


