
Mathematics, 30.03.2021 15:50 krandall232
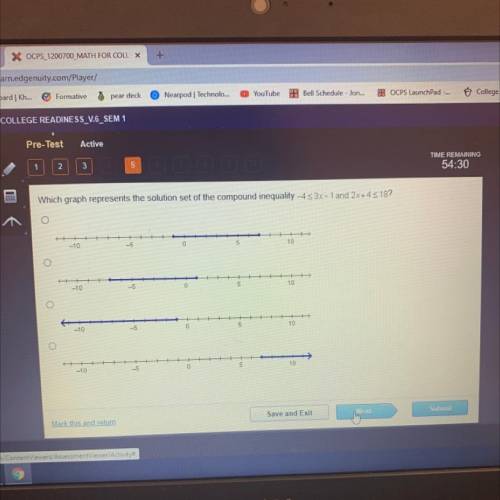
Which graph represents the solution set of the compound inequality -4<3x-1 and 2x+4 < 18?
-10
-5
0
5
10
5
5
-10
10
+
-5
--10
0
5
10
.
0
5
10
-5
-10

Answers: 3


Other questions on the subject: Mathematics
Mathematics, 21.06.2019 14:10, valeriam24
which best describes the transformation from the graph of f(x) = x2 to the graph of f(x) = (x – 3)2 – 1? left 3 units, down 1 unitleft 3 units, up 1 unitright 3 units, down 1 unit right 3 units, up 1 unit
Answers: 1
Mathematics, 21.06.2019 15:30, fooligan3448
The local farm is advertising a special on fresh picked peaches. the farm charges $4.25 to pick your own peck of peaches and $3.50 for each additional peck you pick. write an equation for the total cost of peaches in terms of the number of pecks. deine your variables. how much does it cost to pick 3 pecks of peaches?
Answers: 3
Mathematics, 21.06.2019 18:00, jabraeshaw
Which shows the correct solution of the equation 1/2a+2/3b=50, when b=30?
Answers: 1
Mathematics, 21.06.2019 19:00, naomicervero
Four individuals pool money together to start a new business and agree to split the profits equally. n invests $6,000, x invests $2,000, y invests $8,000 and z invests $4,000. if the profits for the first month were $100,000, y receives than if the profits were divided in proportion to how much they invested.
Answers: 3
You know the right answer?
Which graph represents the solution set of the compound inequality -4<3x-1 and 2x+4 < 18?
-10...
Questions in other subjects:


Mathematics, 20.02.2020 04:31
Mathematics, 20.02.2020 04:31
Mathematics, 20.02.2020 04:31

Chemistry, 20.02.2020 04:31


