
Mathematics, 30.03.2021 16:00 enazer
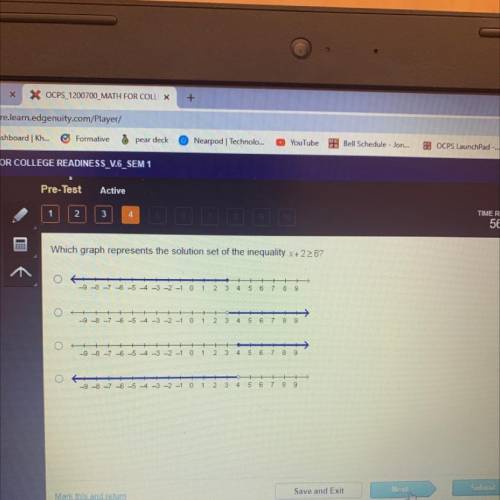
Which graph represents the solution set of the inequality x+2267
9-8-7 6 5 4 -3 -2 -1 0 1 2 3 4 5 6 7
8 9
98 -7 -6 -5 4 -3 -2 -1 0 1
2
3 4 5 6 7 8 9
98 -7 -6 -5 4 -3 -2 -1 0 1 2 3 4 5 6 7 8 9
--98 -7 -6 -5 4 -3 -2 -1 0 1 2 3 4 5 6 7 8 9

Answers: 1


Other questions on the subject: Mathematics
Mathematics, 21.06.2019 15:00, lulustar13
Prove that 3: 8 is equivalent to 12: 32.a. use diagrams to support your answer.
Answers: 1
Mathematics, 21.06.2019 22:30, clickbaitdxl
Pls never taught i’m really confused and i rlly need
Answers: 1
Mathematics, 21.06.2019 23:30, jadynsantiago
Ana earns 2.5% simple interest on $2,000 in her savings account. she does not make any deposits or withdrawals. after 3 years, how much interest will ana have earned on her savings account?
Answers: 1
You know the right answer?
Which graph represents the solution set of the inequality x+2267
9-8-7 6 5 4 -3 -2 -1 0 1 2 3 4 5 6...
Questions in other subjects:


History, 27.09.2020 01:01
Mathematics, 27.09.2020 01:01
Mathematics, 27.09.2020 01:01

Mathematics, 27.09.2020 01:01
Mathematics, 27.09.2020 01:01


