
Mathematics, 30.03.2021 07:10 raymondanthony6567
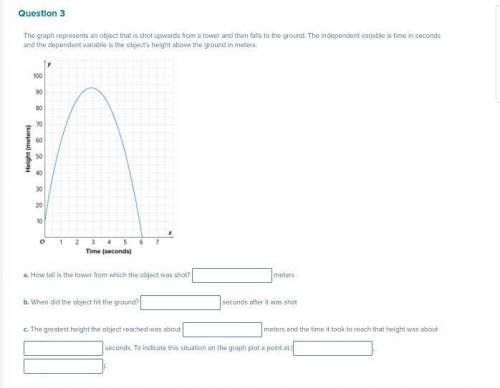
The graph represents an object that is shot upwards from a tower and then falls to the ground. The independent variable is time in seconds and the dependent variable is the object’s height above the ground in meters.
How tall is the tower from which the object was shot?
When did the object hit the ground?
Estimate the greatest height the object reached and the time it took to reach that height. Indicate this situation on the graph.

Answers: 2


Other questions on the subject: Mathematics
Mathematics, 21.06.2019 18:50, umarhaley
The avenues in a particular city run north to south and are numbered consecutively with 1st avenue at the western border of the city. the streets in the city run east to west and are numbered consecutively with 1st street at the southern border of the city. for a festival, the city is not allowing cars to park in a rectangular region bordered by 5th avenue to the west. 9th avenue to the east, 4th street to the south, and 6th street to the north. if x is the avenue number and yis the street number, which of the following systems describes the region in which cars are not allowed to park? 5th ave 9th ave
Answers: 1
You know the right answer?
The graph represents an object that is shot upwards from a tower and then falls to the ground. The i...
Questions in other subjects:

Mathematics, 24.03.2020 22:54


Mathematics, 24.03.2020 22:54
Mathematics, 24.03.2020 22:54

Mathematics, 24.03.2020 22:54


