


Slide the green dot from 0 to plot the number at the correct
location.
The value for V1...

Mathematics, 30.03.2021 01:20 DanteMadrid33
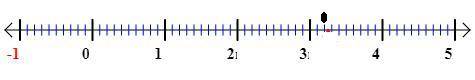
Slide the green dot from 0 to plot the number at the correct
location.
The value for V10 is approximately between 3 and 4
Approximate further to find the values to the tenths
place that v10 is between
Plot V10.
a <√10 ch
tra=
b =

Answers: 2


Other questions on the subject: Mathematics
Mathematics, 21.06.2019 18:00, cashhd1212
The given dot plot represents the average daily temperatures, in degrees fahrenheit, recorded in a town during the first 15 days of september. if the dot plot is converted to a box plot, the first quartile would be drawn at __ , and the third quartile would be drawn at __ link to graph: .
Answers: 1
You know the right answer?
Questions in other subjects:
Mathematics, 22.06.2019 01:30
Mathematics, 22.06.2019 01:30

Business, 22.06.2019 01:30


