
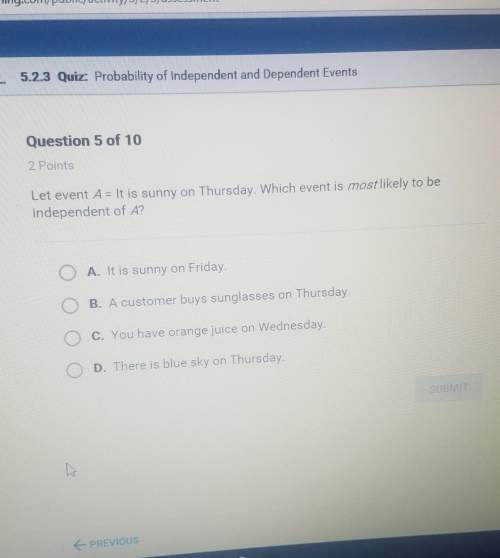
Mathematics, 29.03.2021 23:50 kloeydrea08
The histograms below show the ages of dogs at four different shelters. For which set of data is the mean most likely less than the median?
(If you're having trouble seeing, X is the Age, Y is the amount of Dogs.)
I know it's not B, because I took this test before, and it said that was incorrect.

Answers: 3


Other questions on the subject: Mathematics
Mathematics, 21.06.2019 20:00, gordon57
Someone answer asap for ! max recorded the heights of 500 male humans. he found that the heights were normally distributed around a mean of 177 centimeters. which statements about max’s data must be true? a. the median of max’s data is 250 b. more than half of the data points max recorded were 177 centimeters. c. a data point chosen at random is as likely to be above the mean as it is to be below the mean. d. every height within three standard deviations of the mean is equally likely to be chosen if a data point is selected at random.
Answers: 1
Mathematics, 21.06.2019 21:30, Officaljazz18
Which best describes the construction of a triangle if given the segment lengths of 2 cm, 3 cm, and 5 cm? a) unique triangle b) cannot be determined c) triangle not possible d) more than one triangle
Answers: 1
You know the right answer?
The histograms below show the ages of dogs at four different shelters. For which set of data is the...
Questions in other subjects:

Physics, 30.03.2020 10:15

English, 30.03.2020 10:28
Mathematics, 30.03.2020 10:29
English, 30.03.2020 10:29


