
Mathematics, 29.03.2021 23:30 TheSmartRey
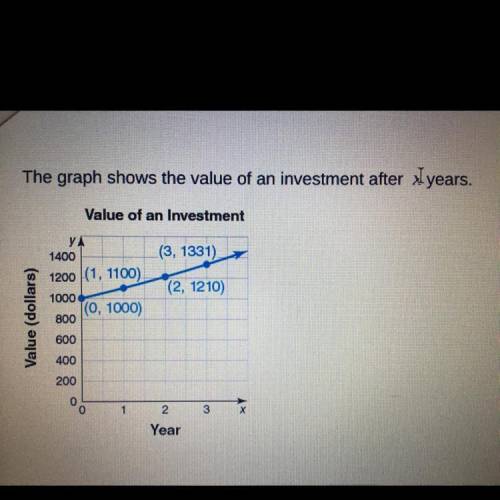
The graph shows the value of an investment after x years. The initial amount is $1,000, the investment grows at a rate of __ each year, and the value of the investment after 10 years is $___

Answers: 2


Other questions on the subject: Mathematics
Mathematics, 21.06.2019 20:20, rleiphart1
Which of the following values are in the range of the function graphed below? check all that apply ! - will give the answer "brainliest! "
Answers: 1
Mathematics, 21.06.2019 20:30, cld3331
Merrida uses a pattern in the multiplication table below to find ratios that are equivalent to 7: 9. if merrida multiplies the first term, 7, by a factor of 6, what should she do to find the other term for the equivalent ratio? multiply 9 by 1. multiply 9 by 6. multiply 9 by 7. multiply 9 by 9.
Answers: 1
Mathematics, 22.06.2019 00:00, jonmorton159
Need plz been trying to do it for a long time and still haven’t succeeded
Answers: 1
You know the right answer?
The graph shows the value of an investment after x years.
The initial amount is $1,000, the investm...
Questions in other subjects:

Arts, 07.01.2021 22:20

History, 07.01.2021 22:20
Mathematics, 07.01.2021 22:20

Mathematics, 07.01.2021 22:20


