
Mathematics, 29.03.2021 20:30 tyrique86
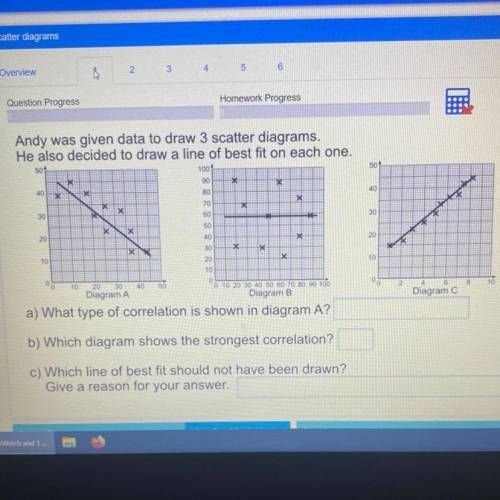
Andy was given data to draw 3 scatter diagrams.
He also decided to draw a line of best fit on each one.
50
100
50
90
*
X
40 5
80
40
EX
X
70
X
F
X
30
60
30
50
X
IX
20
40
X
20
TX
30
*
X
10
20
10
0 0
10
30
40
50
10
0
0 10 20 30 40 50 60 70 80 90 100
Diagram B
00
2
8
10
Diagram C
20
Diagram A
a) What type of correlation is shown in diagram A?
b) Which diagram shows the strongest correlation?
c) Which line of best fit should not have been drawn?
Give a reason for your answer.

Answers: 2


Other questions on the subject: Mathematics
Mathematics, 21.06.2019 20:00, Serenitybella
2.5 milligrams is equivalent to how many grams
Answers: 2
Mathematics, 21.06.2019 20:40, jaydenrobinettewca
Ineed someone to me answer my question i have to have this done and knocked out
Answers: 2
Mathematics, 22.06.2019 02:30, mohamedramadan
Use stokes' theorem to evaluate c f · dr where c is oriented counterclockwise as viewed from above. f(x, y, z) = xyi + 5zj + 7yk, c is the curve of intersection of the plane x + z = 8 and the cylinder x2 + y2 = 81.
Answers: 2
You know the right answer?
Andy was given data to draw 3 scatter diagrams.
He also decided to draw a line of best fit on each...
Questions in other subjects:
Mathematics, 27.01.2021 17:40
Mathematics, 27.01.2021 17:40
Mathematics, 27.01.2021 17:40


English, 27.01.2021 17:40
Mathematics, 27.01.2021 17:40

Biology, 27.01.2021 17:40

Chemistry, 27.01.2021 17:40


