50 points for this !
the graph shows the distribution of hand lengths, in centimeters,...

Mathematics, 05.01.2020 02:31 kylee65
50 points for this !
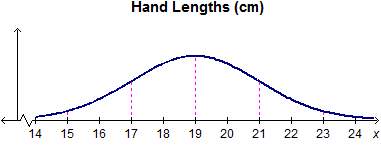
the graph shows the distribution of hand lengths, in centimeters, of the members of an orchestra.
what is the variance of the data?
1
2
4
5

Answers: 2


Other questions on the subject: Mathematics
Mathematics, 21.06.2019 17:40, kiingbr335yoqzaxs
Given abcd ac=38 and ae=3x+4 find the value of x
Answers: 2
Mathematics, 21.06.2019 22:30, qveensentha59
Which of the functions below could have created this graph?
Answers: 1
Mathematics, 21.06.2019 23:50, obrunelle4678
Solve for x in the equation x2 - 12x + 36 = 90. x= 6+3x/10 x=6+2/7 x= 12+3/22 x = 12+3/10
Answers: 2
Mathematics, 22.06.2019 01:30, datboyjulio21
Im so bad at fractions they are not my best math thing to work on
Answers: 1
You know the right answer?
Questions in other subjects:

Health, 05.03.2021 19:00
Mathematics, 05.03.2021 19:00
Mathematics, 05.03.2021 19:00


Social Studies, 05.03.2021 19:00


History, 05.03.2021 19:00
History, 05.03.2021 19:00


