
Mathematics, 29.03.2021 08:20 theyfallfora
Do both A and B please
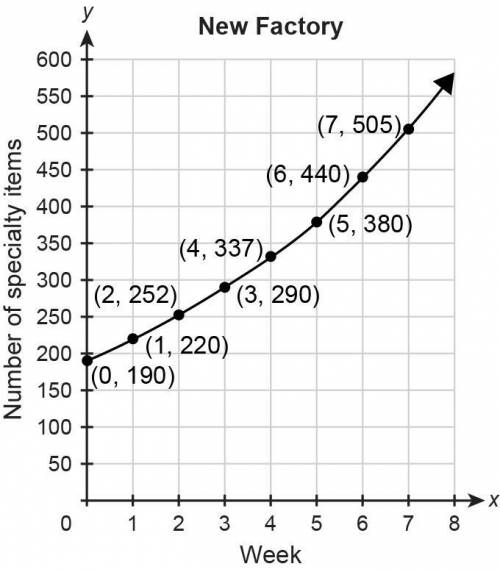
The function p(w)= 230(1.1)^w represents the number of specialty items produced at the old factory w weeks after a change in management. The graph represents the number of specialty items produced at the new factory during the same time period.
(a) During Week 0, how many more specialty items were produced at the old factory than at the new factory? Explain.
(b) Find and compare the growth rates in the weekly number of specialty items produced at each factory. Show your work.

Answers: 2


Other questions on the subject: Mathematics
Mathematics, 22.06.2019 00:20, arianasg06
When steve woke up. his temperature was 102 degrees f. two hours later it was 3 degrees lower. what was his temperature then?
Answers: 3
Mathematics, 22.06.2019 05:30, nathanscastr02
What is a rule for determining possible values of a variable in a inequality
Answers: 3
You know the right answer?
Do both A and B please
The function p(w)= 230(1.1)^w represents the number of specialty items produ...
Questions in other subjects:


Mathematics, 29.12.2020 06:40


Physics, 29.12.2020 06:40
Mathematics, 29.12.2020 06:40

History, 29.12.2020 06:40
Mathematics, 29.12.2020 06:40
Mathematics, 29.12.2020 06:40


