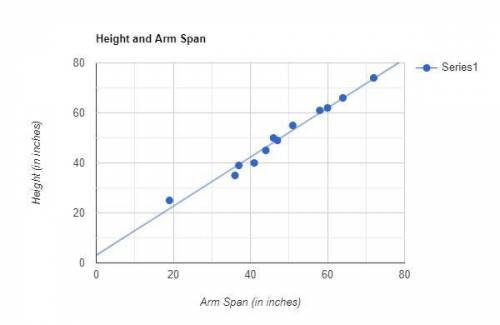
Arm Span (inches) Height (inches)
60 62
72 74
64 66
51 55
19 25
37 39...

Mathematics, 29.03.2021 01:00 20brooklyn22
Arm Span (inches) Height (inches)
60 62
72 74
64 66
51 55
19 25
37 39
44 45
47 49
36 35
41 40
46 50
58 61
Which variable did you plot on the x-axis, and which variable did you plot on the y-axis? Explain why you assigned the variables in that way.
Write the equation of the line of best fit using the slope-intercept formula y = mx + b. Show all your work, including the points used to determine the slope and how the equation was determined.
What does the slope of the line represent within the context of your graph? What does the y-intercept represent?
Test the residuals of two other points to determine how well the line of best fit models the data.
Use the line of best fit to help you to describe the data correlation.
Using the line of best fit that you found in Part Three, Question 2, approximate how tall is a person whose arm span is 66 inches?
According to your line of best fit, what is the arm span of a 74-inch-tall person?

Answers: 2


Other questions on the subject: Mathematics
Mathematics, 21.06.2019 14:30, mathewsjayden45
4. find the geometric mean of 4 and 12. 24 8
Answers: 3
Mathematics, 21.06.2019 15:00, Chanman40025
The triangles are similar. what is the value of x? show your work.
Answers: 2
Mathematics, 21.06.2019 16:00, asdf334asdf334
Josephine has a great garden with and area of 2x2 + x - 6 square feet
Answers: 2
You know the right answer?
Questions in other subjects:


Mathematics, 04.12.2020 02:10

History, 04.12.2020 02:10
Mathematics, 04.12.2020 02:10
History, 04.12.2020 02:10


