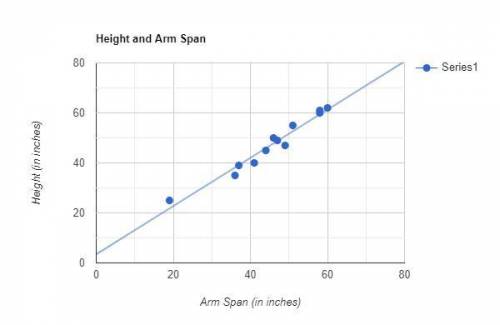
Which variable did you plot on the x-axis, and which variable did you plot on the y-axis? Explain why you assigned the variables in that way.
Write the equation of the line of best fit using the slope-intercept formula y = mx + b. Show all your work, including the points used to determine the slope and how the equation was determined.
What does the slope of the line represent within the context of your graph? What does the y-intercept represent?
Test the residuals of two other points to determine how well the line of best fit models the data.
Use the line of best fit to help you to describe the data correlation.
Using the line of best fit that you found in Part Three, Question 2, approximate how tall is a person whose arm span is 66 inches?
According to your line of best fit, what is the arm span of a 74-inch-tall person?
Astore is having a sale in which all items are reduced by 20 percent. including tax, jennifer paid $21 for a pair of shorts. if the sales tax is 5 percent, what was the original price of the shorts
Scarlett stopped at a campground along the appalachian trail. the campground had a 12 acre area for tents, divided into 6 equal campsites. scarlett picked one of the sections to pitch her tent. which expression would give you the size of scarlett’s campsite? (more than one answer