
Mathematics, 28.03.2021 20:20 garrismunoz
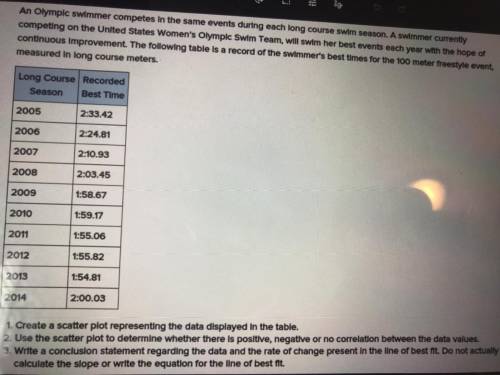
An Olympic swimmer competes in the same events during each long course swim season. A swimmer currently
competing on the United States Women's Olympic Swim Team, will swim her best events each year with the hope of
continuous Improvement. The following table is a record of the swimmer's best times for the 100 meter freestyle event,
measured In long course meters.
Long Course Recorded
Season Best Time
2005 2:33.42
2006
2:24.81
2007
2:10.93
2008
2:03.45
2009
1:58.67
2010
1:59.17
1:55.06
2011
2012
1:55.82
2013
1:54.81
2014
2:00.03
1. Create a scatter plot representing the data displayed in the table.
2. Use the scatter plot to determine whether there is positive, negative or no correlation between the data values.
3. Write a conclusion statement regarding the data and the rate of change present in the line of best fit. Do not actually
calculate the slope or write the equation for the line of best fit.
Please help me
Will give
Just give me the answer to 2 and 3
I already have 1
I just need 2 and 3
Please and thank you
Please answer this

Answers: 1


Other questions on the subject: Mathematics
Mathematics, 21.06.2019 12:50, rntaran2002
Nneeedd 1.find the residual if you know the actual number is 5.2 and the predicted value is 4.8
Answers: 3
Mathematics, 21.06.2019 13:20, emmmssss21
Which statement explains how you could use coordinate geometry to prove that quadrilateral abcd is a parallelogram? -5 -4 -3 -2 -1 t 1 2 3 4 prove that all sides are congruent and have slopes that are opposite reciprocals prove that segments ad and ab are congruent and parallel prove that opposite sides are congruent and have equal slopes prove that segments bc and cd are congruent and parallel
Answers: 1
Mathematics, 21.06.2019 20:00, anthonybowie99
The art class is planning to paint a mural on an outside wall. this figure is a scale drawing of the wall. width: 11 in length: 28 in unit rate: 1.5 ft per in. write the ratio of the area of the drawing to the area of the actual mural. write your answer as a unit rate. show that this unit rate is equal to the square of the unit rate 1.5 ft per in
Answers: 1
You know the right answer?
An Olympic swimmer competes in the same events during each long course swim season. A swimmer curren...
Questions in other subjects:

Biology, 29.06.2019 00:10
Mathematics, 29.06.2019 00:10
Mathematics, 29.06.2019 00:10
Mathematics, 29.06.2019 00:10

Advanced Placement (AP), 29.06.2019 00:10
Mathematics, 29.06.2019 00:10


