
Mathematics, 28.03.2021 20:10 jadens25
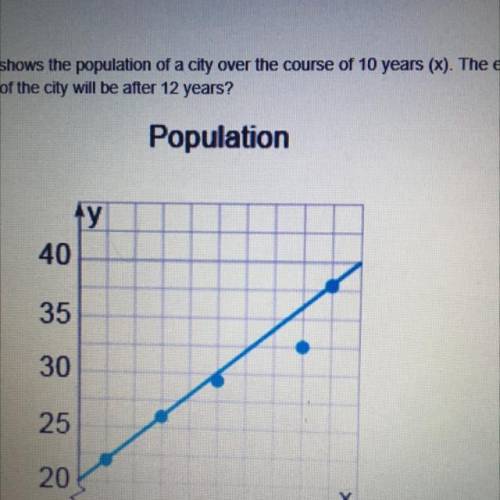
The graph shows the population of a city over the course of 10 years (X). The equation of the trend line shown is y = 1.9x + 21. What can we predict the population of the city will be after 12 years

Answers: 1


Other questions on the subject: Mathematics
Mathematics, 21.06.2019 17:30, davidgarcia522083
Which expression can be used to determine the slope of the line that passes through the points -6, three and one, -9
Answers: 3
Mathematics, 21.06.2019 22:30, josephfoxworth
Your best friend told you that last week scientists disco y that las vegas is responsible for abrupt climate changes. which do you think is best way to research that recent discovery? an encyclopedia usgs internet site a book in the library your best friend’s parents for your ! ❤️
Answers: 2
You know the right answer?
The graph shows the population of a city over the course of 10 years (X). The equation of the trend...
Questions in other subjects:
Mathematics, 27.02.2021 03:00

Chemistry, 27.02.2021 03:00
Mathematics, 27.02.2021 03:00


Computers and Technology, 27.02.2021 03:00

Arts, 27.02.2021 03:00


