
Mathematics, 28.03.2021 18:20 shawny5
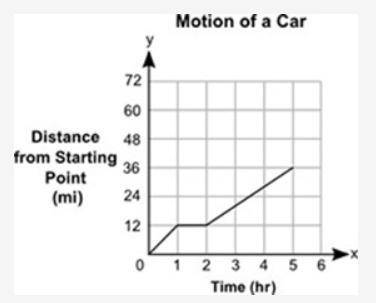
The distance, y, in miles, traveled by a car in a certain amount of time, x, in hours, is shown in the graph below:
Which of the following best describes the motion of the car shown?
It travels for 1 hour, then stops for 1 hour, and finally travels again for 3 hours.
It travels for 2 hours, then stops for 1 hour, and finally travels again for 2 hours.
It travels for 1 hour, then stops for 2 hours, and finally travels again for 5 hours.
It travels for 2 hours, then stops for 3 hours, and finally travels again for 5 hours.

Answers: 1


Other questions on the subject: Mathematics
Mathematics, 21.06.2019 17:10, ohartshorn3670
Consider the functions below. function 1 function 2 function 3 select the statement which is true about the functions over the interval [1, 2] a b function 3 has the highest average rate of change function 2 and function 3 have the same average rate of change. function and function 3 have the same average rate of change function 2 has the lowest average rate of change d.
Answers: 3
Mathematics, 21.06.2019 18:00, kellysmith45
The chs baseball team was on the field and the batter popped the ball up. the equation b(t)=80t-16•16+3.5 represents the height of the ball above the ground in feet as a function of time in seconds. how long will the catcher have to get in position to catch the ball before it hits the ground? round to the nearest second
Answers: 3
You know the right answer?
The distance, y, in miles, traveled by a car in a certain amount of time, x, in hours, is shown in t...
Questions in other subjects:


Social Studies, 02.06.2021 02:20
Mathematics, 02.06.2021 02:20
Mathematics, 02.06.2021 02:20
Social Studies, 02.06.2021 02:20


