
Mathematics, 28.03.2021 05:10 montgomerykarloxc24x
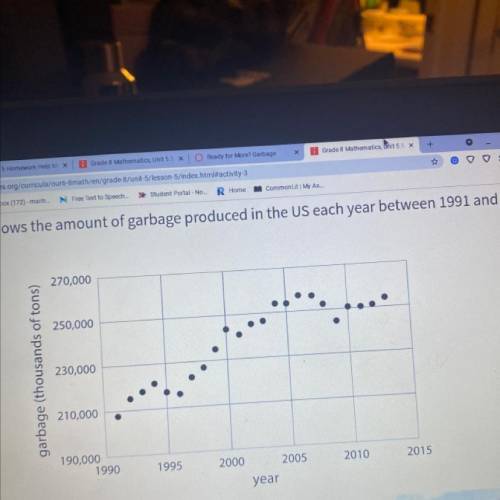
Refer to the graph on page 44.
1. Find a year where the amount of garbage produced increased from the previous year, but not by as
much it increased the following year.
2. Find a year where the amount of garbage produced increased from the previous year, and then
increased by a smaller amount the following year.
3. Find a year where the amount of garbage produced
decreased from the previous year, but not by as
much it decreased the following year.
4. Find a year where the amount of garbage produced decreased from the previous year, and then
decreased by a smaller amount the following year.

Answers: 3


Other questions on the subject: Mathematics
Mathematics, 22.06.2019 00:00, baileypreston311
Use the given information to determine the exact trigonometric value.
Answers: 3
Mathematics, 22.06.2019 00:00, girlieredc
Apolygon is shown on the graph: a polygon is shown on the coordinate plane. vertices are located at 3 comma 5, 1 comma 3, 1 comma 1, 2 comma 0, 4 comma 0, 5 comma 1, and 5 comma 3. what effect will a translation 3 units down and 2 units left have on the polygon? be sure to address how it could impact the angles, side lengths, and congruency between the original pre-image and the image. xd i need
Answers: 3
Mathematics, 22.06.2019 05:00, kcombest7219
On average, a continental shelf drops 0.12 m per 100 m. at 22.5 m from the shoreline, how much distance has the continental shelf dropped?
Answers: 1
You know the right answer?
Refer to the graph on page 44.
1. Find a year where the amount of garbage produced increased from t...
Questions in other subjects:


Social Studies, 04.08.2019 05:50

Biology, 04.08.2019 05:50
Mathematics, 04.08.2019 05:50
Mathematics, 04.08.2019 05:50

Computers and Technology, 04.08.2019 05:50

Mathematics, 04.08.2019 05:50


