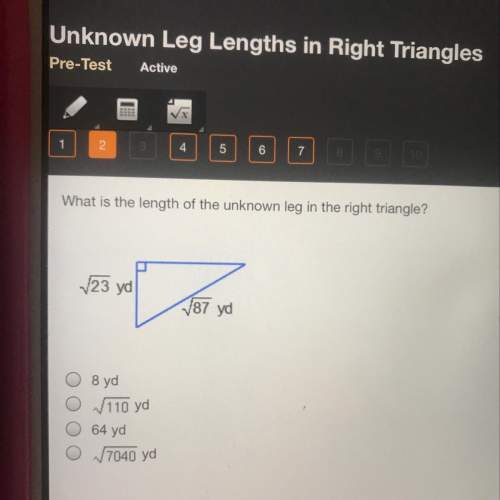
something that characterises a right triangle is the fact that we may use pythagoras' theorem to find any one of its sides given that we have the length of the other two sides. here, we have the length of the hypotenuse, √(87) yd, and one other side, √(23) yd, thus we can easily find the length of the remaining side using pythagoras' theorem as defined below:
c^2 = a^2 + b^2, where c is the length of the hypotenuse, and a and b are the lengths of the other two sides.
thus, given that c = √(87) and a = √(23), we may substitute these into the formula we defined above to get:
c^2 = a^2 + b^2
(√87)^2 = (√23)^2 + b^2 (substitute c = √87 and a = √23 into the equation)
87 = 23 + b^2 (evaluate (√87)^2 = 87 and (√23)^2 = 23 - remember that the square root of a number, squared will equal that very same number)
64 = b^2 (subtract 23 from both sides)
√64 = b (take the square root of both sides)
8 = b (evaluate √64 = 8)
therefor, the length of the unknown leg in the right triangle is 8 yd (first answer).