
Mathematics, 26.03.2021 23:40 jasminerainn
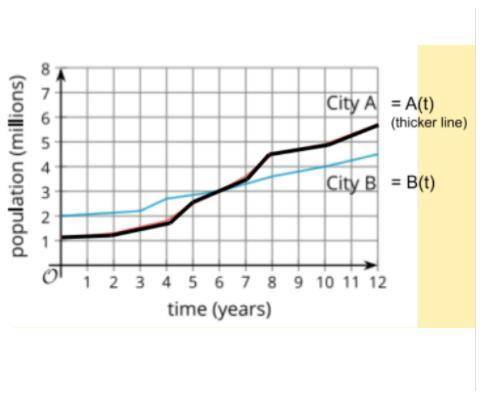
This graph shows the population (in millions) of two cities over 12 years since 1990. Each graph represents the population (in millions) as a function of time (in years). Which function value is greater A(4) or B(4)?

Answers: 1


Other questions on the subject: Mathematics
Mathematics, 21.06.2019 20:00, chantelporter713
Afamily has five members. a mom, a dad, two sisters, & a brother. the family lines up single file. what is the probabillity that the mom is at the front of the line
Answers: 1
Mathematics, 21.06.2019 23:00, LillianMRucker
Atriangle in the coordinates of (2,3), (-4,5) and (-2,4) it is translated 3 units down. what are it’s new coordinates
Answers: 1
You know the right answer?
This graph shows the population (in millions) of two cities over 12 years since 1990. Each graph rep...
Questions in other subjects:

Chemistry, 19.05.2021 09:30

Mathematics, 19.05.2021 09:30
Mathematics, 19.05.2021 09:30

History, 19.05.2021 09:30

Physics, 19.05.2021 09:30
Mathematics, 19.05.2021 09:30


