
Mathematics, 26.03.2021 22:00 ruslffdr
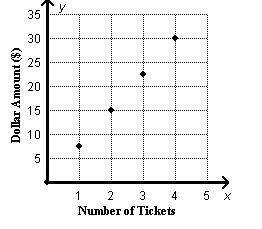
The graph below shows the relationship between the amount of money Martin will spend, y, and the number of tickets he buys, x. Which equation represents the relationship between x and y?

Answers: 2


Other questions on the subject: Mathematics
Mathematics, 21.06.2019 15:30, davidaagurto
Jordan rides his bike 6 7/15 miles every day to deliver newspapers and to go to and from school. if his ride to and from school is 4 3/10 miles, how many miles is the trip to deliver newspapers? 1 1/3 1 1/6 2 1/6 2 4/5
Answers: 1
Mathematics, 22.06.2019 00:30, trinityhayes347
Javier bought a painting for $150. each year, the painting's value increases by a factor of 1.15. which expression gives the painting's value after 77 years?
Answers: 2
You know the right answer?
The graph below shows the relationship between the amount of money Martin will spend, y, and the num...
Questions in other subjects:

English, 29.10.2019 12:31

History, 29.10.2019 12:31
Mathematics, 29.10.2019 12:31
History, 29.10.2019 12:31
Mathematics, 29.10.2019 12:31


